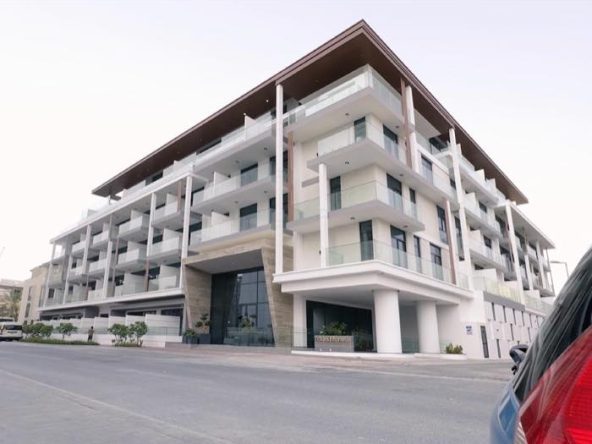









Will Dubai Property Prices Rise? Data and Outlooks, 2026
Will Dubai property prices rise? On 28 October 2026 the published record points in different directions depending on the series. The Dubai Land Department (DLD) recorded about 270,000 transactions worth AED 917 billion ($249.7 billion) in 2025, up 20% on 2024 (Gulf News). In 2026 the price series diverge: CBRE reported home sale prices 1.9% higher year on year in Q2, ValuStrat reported apartments 3% lower year on year in the same quarter, and Knight Frank said on 6 July that mainstream prices had ebbed by 5-20% depending on location. Residential sales volumes in the third quarter were about 38% below a year earlier on both the Savills and Cavendish Maxwell counts.
This article does not answer the question with a prediction, because none is made here. It sets out, with dates, methods and named sources, what has happened to prices and transactions, what the supply pipeline looks like on each counter, what the macro sources cite as of 28 October 2026, what each published outlook says and what its authors say would make it wrong, and how to read a forecast. Amounts in dirhams are shown with US dollars in brackets at the fixed rate of 3.6725 dirhams per dollar. The history of the 2008-2011 fall is covered in a separate article on whether the Dubai property market will crash, and this one stays with the 2026 evidence and the outlooks.
Will Dubai Property Prices Rise? The Record on 28 October 2026
No single number describes the Dubai residential market, because the sources count different things: all real-estate transactions or residential sales only, registered deals or valuations, averages or medians, and every unit sold or like-for-like comparisons. The first table puts the main published readings side by side with the date of each. The sections after it explain how each series is built, so that a reader can see why a 3% fall in one place and a 1.9% rise in another can both be accurate.
| Measure | Reading | Source and date |
|---|---|---|
| Registered transactions, 2025 | About 270,000, worth AED 917 billion ($249.7 billion); both up 20% on 2024 | DLD data, Gulf News, 12 January 2026 |
| Registered transactions, Q1 2026 | AED 252 billion ($68.6 billion), up 31% in value; 60,303 transactions, up 6% | DLD, 9 April 2026 |
| Residential sales, Q3 2026 | About 34,000 sales worth over AED 72.6 billion ($19.8 billion); down 38% in count and 47% in value year on year | Cavendish Maxwell Q3 2026 release, cited by Khaleej Times, 7 October 2026 |
| Average residential price, August 2026 | AED 1,636 ($445) per sq ft; down 1.7% year on year and 1.3% over three months | Cavendish Maxwell data; Engel & Völkers, 9 September 2026 |
| Apartments and villas, Q3 2026 | REIDIN index: apartments down 0.4% and villas down 1.1% on the quarter | REIDIN, 28 October 2026 |
| Valuation index, Q2 2026 | ValuStrat residential index 220.0, down 4% on the quarter, up 0.1% on the year; about 10% below late February | ValuStrat Q2 2026 review |
| Valuation index, Q3 2026 | Prices broadly unchanged on the previous quarter | ValuStrat data, Dubai Chronicle, 21 October 2026 |
| Mainstream prices, first half of 2026 | Ebbed by 5-20% depending on location | Knight Frank, 6 July 2026 |
| UAE real GDP, 2026 | Contraction of 3.9% in 2026, rebound of 7.7% in 2027 (IMF) | The National on the IMF, 13 October 2026 |
| Dubai population | 4,807,185 on 28 September 2026; up 226,885 since the start of the year | Gulf News, 29 September 2026, citing the Dubai Data and Statistics Establishment |
Two features of the table matter for everything that follows. First, the series differ in what they measure and when: Knight Frank’s 5-20% range is a statement about mainstream prices by location, ValuStrat’s index is a valuation index, and the Cavendish Maxwell figure is an average of registered sales per square foot. Second, the dates differ. A reading for June predates the third-quarter registrations, and a reading for the third quarter includes sales that were agreed earlier and registered later, a lag that Cavendish Maxwell and Knight Frank both refer to.
How Each Dubai Price Series Is Built
A statement such as prices fell or prices rose is only as informative as the method behind it, and anyone asking will Dubai property prices rise meets the problem at once, because the answer changes with the series chosen. Seven series are used in this article. Their methods, as the publishers describe them, are in the table below.
| Series | What it measures | Method as the publisher describes it |
|---|---|---|
| DLD Dubai House Price Index (residential sales price index) | Residential sales, split into all, apartments and villas/townhouses | Hedonic imputation method, which treats homes as bundles of attributes; base 2012 = 1; monthly, quarterly and yearly (DLD open-data page) |
| ValuStrat Price Index (VPI) | Capital values of a sample of residential properties | Valuation-based, marked to market by RICS Registered Valuers; the sample covers more than 90% of the Dubai residential and commercial markets; base January 2021 = 100 (ValuStrat Q2 2026 review) |
| Cavendish Maxwell sales price | Average residential sale price per square foot | Average price per square foot of residential sales (Cavendish Maxwell data via Zawya) |
| Savills Dubai residential report | Average price per square foot of apartments and of villas/townhouses, plus a like-for-like measure | Headline averages move with the mix of what sold; the like-for-like measure compares similar homes (Savills via Zawya) |
| REIDIN Dubai indices | Apartment and villa price indices, monthly and quarterly | Monthly and quarterly percentage changes in the apartment and villa indices (REIDIN, 28 October 2026) |
| fäm Properties / DXBinteract | Median price per square foot and counts from DLD records | Medians, not averages; segment medians are not combined into a citywide median (fäm Properties, September 2026 report) |
| CBRE and Cushman & Wakefield Core | Quarterly citywide sale price and rent changes | Quarter-on-quarter and year-on-year changes in each firm’s Dubai residential reports (Gulf News on CBRE; Khaleej Times on Cushman & Wakefield Core) |
Average, median and like-for-like
An average price per square foot adds up the value of every registered sale and divides by the area sold. If a month contains more small studios in outer communities and fewer large villas, the average falls even though no individual home has changed in price. A median picks the middle sale instead, which limits the effect of a few very large deals but still moves with mix. A like-for-like measure holds the mix constant by comparing similar homes. Savills makes the distinction in its own report: it said headline movements are partly driven by changes in the type and value of properties being transacted, and it reported apartments down 1.7% and villas and townhouses unchanged on its like-for-like measure, against headline falls of 4.8% and 3.3% on the quarter.
Transactions, valuations and asking prices
Transaction-based series record what buyers and sellers agreed, but registration comes after agreement. Knight Frank said on 6 July 2026 that deals closed before the conflict were registered four to six weeks later, so figures published in the weeks after a shock partly reflect earlier deals. Cavendish Maxwell used similar wording for the third quarter, saying the declines reflected reduced activity as the lag in sales registrations begins to clear. A valuation index such as the VPI does not wait for registrations; ValuStrat says that is why it responds faster to sentiment than DLD data, which can lag. The trade-off is that a valuation is an estimate by a valuer, not a recorded price. Asking prices, which some portals publish, record what sellers want and are a third kind of series, not used for the price tables in this article.
The DLD index and its disclaimers
The DLD publishes a residential sales price index, also called the Dubai House Price Index, on its open-data pages. The page states that DLD and its partner may change the methodology, that no accuracy metrics are provided, and that the index should not be used for pricing, investment decisions or performance measurement. As of 28 October 2026 the figures displayed on that page run to November 2022, so the 2026 readings in this article come from the consultancies and data providers listed above. That is a fact about what is displayed, and it is one reason the sources are quoted by name and date.
What the Price Series Reported in 2026
The next table orders the 2026 readings by the period they describe. Read down a column and the direction is mixed; read across a row and the method explains much of the difference.
| Period | Source and measure | Reading |
|---|---|---|
| December 2025 | Cavendish Maxwell sales price, year on year | More than 12% (as reported in its H1 2026 release) |
| June 2026 | Cavendish Maxwell sales price | Up 1.9% year on year; down about 2.5% on the first quarter |
| Q2 2026 | CBRE, home sale prices | Up 1.9% year on year |
| Q2 2026 | Cushman & Wakefield Core, citywide sale prices | Down 4% on the quarter, to AED 1,673 ($456) per sq ft |
| Q2 2026 | ValuStrat VPI, all residential | 220.0 points; down 4% on the quarter; up 0.1% on the year |
| Q2 2026 | ValuStrat VPI, apartments | 169.1 points; down 3.7% on the quarter and 3% on the year |
| Q2 2026 | ValuStrat VPI, villas | 293.7 points; down 4.2% on the quarter; up 2% on the year |
| August 2026 | Cavendish Maxwell average price per sq ft | AED 1,636 ($445); down 1.7% year on year; first annual decline since February 2021 |
| September 2026 | DXBinteract median price per sq ft (all property types) | AED 1,656 ($451); down 2.0% from AED 1,689 ($460) a year earlier |
| September 2026 | DXBinteract median, apartments | AED 1,675 ($456); down 3.5% year on year |
| September 2026 | DXBinteract median, villas | AED 1,568 ($427); up 15.5% year on year, on 836 villa sales, 60.6% fewer than a year earlier |
| Q3 2026 | Savills average, apartments | AED 1,817 ($495) per sq ft; down 4.8% on the quarter; like-for-like down 1.7% |
| Q3 2026 | Savills average, villas and townhouses | AED 1,523 ($415) per sq ft; down 3.3% on the quarter; like-for-like unchanged |
| Q3 2026 | REIDIN index, apartments and villas | Apartments down 0.4% and villas down 1.1% on the quarter; up 0.3% and 0.1% in September; declines in July and August, levelling in September |
| Q3 2026 | ValuStrat, all residential | Broadly unchanged on the previous quarter; most communities showed no movement |
Apartments and villas
Every source that splits the market shows the two segments behaving differently. ValuStrat’s Q2 index had apartments 3% lower than a year earlier and villas 2% higher. The DXBinteract medians for September show the same direction with a wider gap, but the villa figure rests on 836 sales, so a handful of large deals in a single community can move a median by double digits. Savills’ average for villas and townhouses fell 3.3% on the quarter and its like-for-like measure was unchanged. REIDIN’s Q3 index had villas down slightly more than apartments on the quarter. Reading these together, the direction for villas depends on whether the series is a year-on-year median, a valuation index or a quarterly average, and the sources do not settle it.
Prime homes
Savills reported that transactions above AED 10 million ($2.72 million) numbered 669 in Q3 2026 against 871 in Q2, a fall of 23.2%, while prime apartments averaged AED 5,237 ($1,426) per sq ft, up 4.0% year on year, and prime villas and townhouses AED 2,791 ($760) per sq ft, up 3.6%. ValuStrat reported that prime villas held their value over the year and that 48 homes sold above AED 30 million ($8.17 million) in the quarter. Those are statements about the top of the market. They are not comparable with a citywide average, which is dominated by apartments priced below AED 2 million ($544,588).
Worked arithmetic: cumulative falls and recovery
Monthly percentage changes compound; they do not add. ValuStrat reported monthly declines of 6% in March, 2% in April, 1% in May and 1% in June 2026. Multiplying the remaining shares gives 0.94 x 0.98 x 0.99 x 0.99 = 0.903, a cumulative fall of 9.7%, which matches ValuStrat’s statement of about 10% since late February. On the reported June index of 220.0, that implies a late-February level of about 243.7 (220.0 / 0.903). A fall of 9.7% also needs a rise of 10.7% to return to the starting point (0.097 / 0.903), because the percentage is applied to a smaller base. This is arithmetic on published figures, not a forecast of a recovery.
Unit conversions are another source of apparent disagreement. A median of AED 1,656 per square foot equals about AED 17,825 per square metre ($4,854) at 10.7639 square feet per square metre. A price quoted per square metre in one report and per square foot in another differs by that factor of about 10.76 before any real difference in the market is considered. The same care applies to the Savills mix effect: if the apartment average fell 4.8% and the like-for-like measure fell 1.7% over the same period, the 3.1-point gap would be the part of the headline fall attributable to what was sold. Savills does not label the period of its like-for-like figure, so that reading is conditional.
Transactions: What the DLD and the Consultancies Counted
Volume matters to the price question because a price series built on fewer sales carries more noise. The table below lists the transaction counts published for 2025 and 2026. The DLD figures cover all registered real-estate transactions; the Cavendish Maxwell and Savills figures cover residential sales only, so the two groups should not be subtracted from each other.
| Period | Count and value | Source |
|---|---|---|
| 2025 | About 270,000 transactions, AED 917 billion ($249.7 billion), up 20%; real-estate investments AED 680 billion ($185.2 billion), up 29%; 129,400 new investors | DLD via Gulf News, 12 January 2026 |
| Q1 2026 | 60,303 transactions, up 6%; AED 252 billion ($68.6 billion), up 31%; foreign investment AED 148.35 billion ($40.4 billion), up 26%; 48,448 investors, up 8% | DLD, 9 April 2026 |
| H1 2026, all transactions | 112,850 transactions worth AED 419.94 billion ($114.3 billion) | DLD via Emirates 24|7, 20 July 2026 |
| H1 2026, sales | 86,000 sales worth AED 286.44 billion ($78.0 billion); off-plan 58,840 (AED 139.75 billion ($38.1 billion)); ready 27,160 (AED 146.69 billion ($39.9 billion)) | Same release |
| H1 2026, residential | 79,300 sales worth AED 221.4 billion ($60.3 billion); off-plan nearly 75%; initial off-plan sales 54,700; off-plan resales 4,600, down 51% | Cavendish Maxwell H1 2026 |
| H1 2026, residential (other count) | 80,509 homes worth AED 226.5 billion ($61.7 billion); off-plan 71.3% | Engel & Völkers H1 2026 |
| Q2 2026, residential | Fewer than 37,000 transactions, down 29% from more than 51,000; value AED 88 billion ($24.0 billion) against nearly AED 154 billion ($41.9 billion) | CBRE via Gulf News, 29 July 2026 |
| Q2 2026, residential (ValuStrat) | 35,465 transactions, down 20% on the quarter; off-plan 27,113 deals worth AED 63.7 billion ($17.3 billion); secondary ready 8,011 worth AED 21 billion ($5.72 billion) | ValuStrat Q2 2026 |
| Q3 2026, residential | About 34,500 transactions, down 4% on the quarter and 38% on the year; AED 70.8 billion ($19.3 billion), down 14% on the quarter | Savills, report of 12 October 2026 |
| Q3 2026, residential (other count) | About 34,000 sales, over AED 72.6 billion ($19.8 billion); off-plan 72% of purchases and 65% of value | Cavendish Maxwell |
| January-September 2026, residential | About AED 292 billion ($79.5 billion) from 112,580 purchases; value down 27%, volume down 23% on the same months of 2025 | Same release |
| September 2026, all property | 11,340 sales worth AED 29.73 billion ($8.1 billion), down 44.2% in count and 45.3% in value year on year | fäm Properties / DXBinteract |
What the arithmetic shows
The half-year DLD split shows how counts and values diverge. Off-plan sales were 68.4% of the 86,000 sales by count (58,840 / 86,000) but 48.8% by value (AED 139.75 billion ($38.1 billion) of AED 286.44 billion ($78.0 billion)). The average off-plan sale was therefore about AED 2,375,085 ($646,722), and the average completed sale about AED 5,400,957 ($1,470,649). A shift in the mix between the two moves a citywide average without any change in the price of a given home, which is the same mix effect described in the previous section.
Subtracting the DLD’s first-quarter figures from the half-year figures gives an implied second quarter of AED 167.94 billion ($45.7 billion) and 52,547 transactions, about 33% less in value and 13% fewer in count than the first quarter. The two figures come from different releases (the DLD for Q1, a news report of DLD data for H1), so this subtraction is indicative only. The same exercise on Cavendish Maxwell’s residential series gives a Q3 share of about 30% of the nine-month total of 112,580 purchases (34,000 / 112,580), against the 33% that an even split across three quarters would give. Scope differs again in September: Cavendish Maxwell counted about 10,300 residential transactions worth nearly AED 23.2 billion ($6.3 billion), while DXBinteract counted 11,340 sales of all property types worth AED 29.73 billion ($8.1 billion).
Savills attributed the Q3 moderation mainly to the off-plan segment and to fewer new launches rather than weaker demand, and reported ready-property value rising from AED 21.3 billion ($5.80 billion) in Q2 to AED 25.1 billion ($6.83 billion) in Q3. ValuStrat reported 9,491 resale purchases worth about AED 25 billion ($6.81 billion) in Q3, the first quarterly rise since late 2025, with one in three selling for under AED 1 million ($272,294), and said mortgages funded almost half of ready-property deals. Off-plan sales slowed for a fourth straight quarter on the same source. The two firms describe the same direction in the ready segment even though their counts differ in scope.
The Supply Pipeline and Handover Numbers
Supply is the factor that the rating agencies cite most often when they address the question of will Dubai property prices rise, and it is the one with the widest spread of published numbers. The counters differ in what they call supply: units scheduled, units registered, units under construction beyond a stage, or units expected to complete on historical delivery rates. The table lists each count with its date and definition.
| Source and date | What it counts | Figures |
|---|---|---|
| Moody’s, 10 February 2026 | Homes due in Dubai | About 180,000 over 2026-2028, about 60,000 a year, against 30,000-40,000 a year over the previous five years |
| Fitch, May 2025 | Units slated for delivery | About 250,000 between 2023 and 2026, with a peak of 120,000 in 2026 |
| Knight Frank, 2 February 2026 | Registered project pipeline | More than 160,000 units could enter in 2026; completions in 2025 were 39,700 (64% on time) against 30,500 (50%) in 2024; 20-year average about 36,000 a year |
| Cavendish Maxwell, H1 2026 | Completions, launches and schedule | 24,800 completed in H1 2026, up nearly 38%; 47,000 scheduled for H2 with 14,000-23,500 expected on historical delivery rates; 162,500 scheduled for 2027 and 128,200 for 2028 |
| ValuStrat, Q2 2026 | Completions against a target | About 20,000 completed in H1 2026 (15,039 apartments, 5,218 villas), 15% of a preliminary full-year target of 129,066 |
| Cushman & Wakefield Core, 9 August 2026 | Handovers | More than 13,200 completed in Q2; about 32,000 expected in H2 2026 |
| Cushman & Wakefield Core, 15 August 2026 | Pipeline | About 49,700 units in 2026 (over 20,400 delivered year to date plus about 29,300 expected); about 60,000 in 2027; apartments about 80% |
| Cushman & Wakefield Core, 20 August 2026 | Handovers and planned units | About 55,600 in 2026, the most in a year since 2008; more than 60,000 projected for 2027; of nearly 525,000 planned units to 2030, about 186,000 had passed 20% construction progress |
| ValuStrat, 15 August 2026 | Scheduled completions | About 322,000 units by the end of the decade; housing stock just under 900,000 homes |
| Savills, 12 October 2026 | Launches and scheduled deliveries | About 50,000 launches in the first nine months of 2026, roughly 64% fewer than a year earlier; more than 525,000 units scheduled for 2027-2030 |
| ValuStrat via Dubai Chronicle, 21 October 2026 | Completions | About 33,000 homes completed by the end of September, less than a third of the annual target |
| S&P Global Ratings, 7 October 2026 | Growth in the stock | Residential units, mainly apartments, expected to rise about 20% over two years |
Why the counters differ
Three differences explain most of the spread. The first is the unit of count. A schedule of 160,000 units in the Knight Frank pipeline is a list of registered projects with a delivery date, not a forecast of completions. Knight Frank’s own 2025 comparison shows why the distinction matters: completions of 39,700 in 2025 were 64% of what had been scheduled on time, and the firm’s Shehzad Jamal said the actual completion rate would probably be well below what the pipeline data suggests. The second is the date. The Cushman & Wakefield Core figure for 2026 moved from about 49,700 in a report quoted on 15 August to about 55,600 in one quoted on 20 August, which are two different publications and should be read as such. The third is method. Cavendish Maxwell expects completions of 14,000-23,500 out of 47,000 scheduled for H2, which is 30% to 50% of the schedule (14,000 / 47,000 = 29.8%; 23,500 / 47,000 = 50.0%), based on historical delivery rates.
Worked arithmetic: what the counters imply
Adding Cavendish Maxwell’s 24,800 completions in H1 to its H2 range of 14,000-23,500 gives a full-year 2026 range of 38,800 to 48,300 on that method. As a share of the 160,000 in Knight Frank’s pipeline that is 24% to 30%. Cushman & Wakefield Core’s 55,600 is 35% of the same pipeline, and on ValuStrat’s preliminary target of 129,066 it is 43%. ValuStrat’s own H1 completions (about 20,000) were 15.5% of that target, and its roughly 33,000 by the end of September were 25.6%. On a housing stock of just under 900,000 homes, 55,600 handovers would add about 6.2%, the Knight Frank pipeline of 160,000 would be 17.8%, and ValuStrat’s 322,000 by the end of the decade would be 35.8%. An S&P figure of 20% growth in the stock over two years is of the order of 180,000 homes on a base of 900,000, although S&P’s article does not state the base it used, so that comparison is only a check on scale.
Savills noted that reduced launches and delayed completions are expected to ease near-term supply pressure. Cushman & Wakefield Core said in the same period that contractor capacity and supply-chain issues could delay handovers, and that projects with substantial capital and contractor commitments are less exposed than early-stage ones. ValuStrat’s Haider Tuaima cautioned that delays and rescheduling would likely lead to downward revisions to the pipeline over time. All three statements point to completions below the schedule; none says by how much.
Demand Indicators: Population, Households, Tourism and Output
Any discussion of will Dubai property prices rise has to include demand as well as supply, because prices respond to both, and the official demand series come from the Dubai Data and Statistics Establishment (DDSE), part of Digital Dubai, and from the Department of Economy and Tourism (DET). The table lists the latest readings with dates.
| Indicator | Reading | Source and date |
|---|---|---|
| Population, end of 2025 | 4,580,300 ordinarily resident people | DDSE via Gulf News, 29 September 2026 |
| Population, 28 September 2026 | 4,807,185, up 226,885 since the start of the year | DDSE via Emirates 24|7, 29 September 2026 |
| Population growth in 2025 | About 332,000, from about 4.248 million to 4.58 million | Gulf News |
| Households | 858,000 in 2025, up 62,800 (7.9%) from 795,200 in 2024 | Gulf News |
| International overnight visitors, 2025 | 19.59 million, up 5% on 18.72 million; hotel occupancy 80.7% | DET via Dubai Media Office, 9 February 2026 |
| International overnight visitors, August 2026 | About 869,000, the highest month since February; 6.97 million in January-August | DET via Gulf News, 14 September 2026 |
| Hotel occupancy, 2026 | Low of 36% in March; 66% in August, equal to 89% of August 2025; about 149,000 rooms at the end of August | DET via Gulf News |
| Dubai real GDP, H1 2026 | About AED 473 billion ($128.8 billion), 2.3% below H1 2025; finance and insurance up 8.8%; real estate about 12% of the economy (AED 65.1 billion ($17.7 billion) against AED 61.8 billion ($16.8 billion)) | DDSE data via Dubai Chronicle, 21 October 2026 |
Population arithmetic puts the 2026 pace in context. The 226,885 added between 1 January and 28 September 2026 is 4.95% of the end-2025 population (226,885 / 4,580,300) and about 837 people for each of the 271 days elapsed. The DDSE defines ordinarily resident people as those who usually live in the emirate for at least six months or intend to. In 2025 the number of households rose by 62,800, while Knight Frank counted 39,700 completions; households and completed homes are different units, so the two numbers describe scale and do not measure a gap.
Hotel and visitor data give a second demand reading. August occupancy of 66% as a share of 89% of the prior August implies a prior-year level of about 74% (66 / 0.89), against 80.7% for the whole of 2025. Moody’s wrote on 7 May that a sharp slowdown or reversal in population inflows would worsen absorption risk as completed supply rises, and Fitch said weaker activity, reduced tourism and slower population growth could make the correction larger than first forecast. The population series up to 28 September shows continued growth, and the tourism series shows recovery from the March low; both are descriptions of what has happened, and the two agencies describe what would change their views.
The Macro Context Cited by the Sources on 28 October 2026
Only agencies and official bodies are used in this section, and each statement is attributed and dated. Al Jazeera dated the start of the war to 28 February 2026, when United States and Israeli strikes on Iran began. The IMF’s July statement described the economy as showing remarkable resilience to the conflict in the Middle East, and its October projections attach explicit assumptions about shipping through the Strait of Hormuz. The table gives the indicators that the sources link to the property market.
| Indicator | Reading | Source and date |
|---|---|---|
| UAE base rate | 3.9% from 17 September 2026, up from 3.65%; the Fed target range was raised to 3.75%-4% | Zawya, September 2026 |
| US policy rate | The September rise was the first since 2023 | Dubai Chronicle, 21 October 2026 |
| UAE GDP, 2026 and 2027 | Contraction of 3.9% in 2026 (cut by 7 points from April); rebound of 7.7% in 2027, conditional on shipping normalising | IMF World Economic Outlook via The National, 13 October 2026 |
| UAE GDP, earlier IMF view | Slightly lower in 2026, strong rebound in 2027, assuming gradual normalisation between the US and Iran | IMF staff statement, 17 July 2026 |
| Hormuz assumption | Gradual reopening resumes in March 2027, with pre-war conditions by October 2027; uncertainty stays elevated through 2027 | The National on the IMF, 13 October 2026 |
| Global growth | 3.1% in 2026 and 3.4% in 2027; global headline inflation 4.7% in 2026 | IMF, 13 October 2026 |
| UAE GDP, CBRE view | Contraction of 0.04% in 2026 | CBRE via Gulf News, 29 July 2026 |
| Brent crude | Forecast average $105 a barrel in Q4 2026, $96 for 2026 and $84 in 2027 | EIA, 6 October 2026 |
| Hormuz transits | 31 ships a day in late September against 138 before the war (Windward data) | Al Jazeera, 12 October 2026 |
| Banks | Capital buffers well above required ratios; real-estate exposure contained; liquidity tightened but ample | IMF, 17 July 2026 |
| Real estate (IMF view) | Activity slowed in H1 2026 after several years of strong growth; impact varies by segment and location; prices generally at or above 2025 levels | IMF, 17 July 2026 |
Interest rates
The dirham is pegged to the dollar and the UAE base rate follows the US Federal Reserve. The Central Bank of the UAE raised the base rate by 25 basis points to 3.9% effective 17 September 2026 after the Fed raised its target range to 3.75%-4%. Moody’s listed lower interest rates among the factors that make mortgages more affordable in its February report; rates have since moved the other way, and The National’s report on the IMF’s October outlook noted that the Fed and other central banks have begun raising rates or are expected to. The agencies do not publish a calculation of the effect of the 25-point rise on Dubai prices.
Oil, shipping and the IMF assumptions
The IMF’s July statement said hydrocarbon output was expected to pick up in the second half of 2026 as oil exports recovered after the UAE’s exit from OPEC, and that the on-and-off closure of the Strait of Hormuz was weighing on activity. The October projection is lower than the July wording suggested: a 3.9% contraction in 2026, 7 points below the April projection, then a 7.7% rebound in 2027. The EIA’s October outlook assumes Middle East oil flows stay constrained through the fourth quarter. These are conditional projections, and the conditions are listed in the sources: the pace of reopening, the duration of the conflict and the path of rates.
Tourism, output and the regional events the sources cite
Official and agency sources cite the regional events as drivers of the weaker months. Hotel occupancy reached a low of 36% in March and 66% in August. Dubai’s real GDP for H1 2026 was 2.3% below H1 2025 on DDSE data, with finance and insurance the fastest-growing large sector and transport and storage down 7.4%. Cavendish Maxwell’s Ronan Arthur said purchasing activity became more measured after the conflict began, and Fitch tied its larger-correction view to weaker activity, lower tourism and slower population growth. The same sources also report resilience: the IMF described the banking system as well capitalised, and Savills described the prime segment as resilient. This article does not weigh those statements against each other, and none of them is a statement on whether Dubai property prices will rise.
Rents and Gross Yields as Published
Rents matter to the price question because they feed both owner-occupier affordability and the income that investors compare with purchase prices. The published rent readings are as mixed as the price readings, and for the same reasons: some are indices of new and renewed contracts, some are medians, and some are asking rents. Asking rents are what landlords list; registered rents are what tenants signed.
| Source and period | Measure | Reading |
|---|---|---|
| Cavendish Maxwell, June 2026 | Rent index | Up 7.8% year on year; down 2.5% on the quarter; annual growth was above 11% from 2023 until early 2026 |
| CBRE, Q2 2026 | Average rents | Down 6.2% on the quarter and 2.6% on the year |
| Cushman & Wakefield Core, Q2 2026 | Average rents | Down 6% on the quarter |
| ValuStrat, Q2 2026 | Residential rental index | 205.8, flat on the quarter and up 1.7% on the year |
| ValuStrat, Q3 2026 | Rents | Eased across most home sizes; typical one-bedroom asking rent about AED 81,000 ($22,056) a year |
| Savills, Q3 2026 | Rental transactions | About 181,900, up 16% on Q2 and close to 180,600 in Q3 2025; new leases 44% of activity against 36% in Q2 |
| DXBinteract, September 2026 | Median annual rent, new contracts | Apartments AED 70,000 ($19,061) across 20,204 contracts; villas AED 210,000 ($57,182) across 1,277 |
| DXBinteract, September 2026 | Median annual rent, renewals | Apartments AED 60,000 ($16,338) across 18,206 contracts; villas AED 200,000 ($54,459) across 899 |
The new-lease median for apartments in September (AED 70,000) is 16.7% above the renewal median (AED 60,000), a gap that reflects different units as much as different rents, since the two groups are not the same properties. DXBinteract notes that rental yields cannot be derived from these figures alone.
Gross yields
Gross yield is annual rent divided by purchase price, before service charges, vacancy, management and financing costs. Cavendish Maxwell put average gross yields in H1 2026 at about 7% for apartments and 5% for villas and townhouses, with Dubai Investments Park at 9.7% and International City at 8.9% among apartment communities. Engel & Völkers reported an average gross yield of 6.6% in June 2026 (apartments 6.9%, townhouses 5.1%, villas 4.5%) and about 6.34% for August. The two firms use different samples and months, and neither is a prediction of what a particular purchase would earn.
Will Dubai Property Prices Rise? Published Outlooks, One by One
The table records each outlook with its author, date, method as described, and range. The outlooks are listed by publication date and not ranked. The earliest were written before the war began on 28 February 2026, which affects how they should be read, and the later ones include the conflict among their assumptions.
| Source and author | Date | Method as described | Statement and range |
|---|---|---|---|
| Knight Frank: Faisal Durrani and Shehzad Jamal | 2 February 2026 | Registered-transaction analysis and tracking of the registered project pipeline | Prime prices up about 3% and mainstream prices up about 1% by December 2026; growth to moderate as supply rises; a two-speed market |
| Moody’s: Lisa Jaeger and Francesca Paolino | 10 February 2026 | Rating-agency sector report | Modest cooling in prices and developer sales over 12-18 months; modest outright apartment price declines probable; mid-market studios and one-bedrooms most exposed |
| Fitch Ratings | May 2025; update 1 June 2026 | Rating-agency forecast; inputs cited include prices up nearly 60% from 2022 to Q1 2025 and supply outpacing population growth of about 5% a year | Moderate correction of no more than 15% from H2 2025 (about 15% from July 2025 to end-2026, per Fortune); by June 2026 said the correction may be larger than first forecast |
| IMF staff | 17 July 2026 | Staff visit of 7-16 July 2026 | Prices generally at or above 2025 levels; market conditions need continued monitoring |
| CBRE: Matthew Green | 29 July 2026 (Q2 review) | UAE Real Estate Market Review, Q2 2026 | Home sale prices up 1.9% year on year; impact of moderation uneven; UAE economy to contract 0.04% in 2026 |
| Knight Frank: Faisal Durrani and Nicholas Spencer | 6 July 2026 | Transaction analysis of US$10m+ sales plus market commentary | Mainstream prices ebbed 5-20% by location; prime more resilient with early signs of weakening; impact of the conflict may not be clear until autumn |
| Cushman & Wakefield Core | 9 and 20 August 2026 | Quarterly and half-year market reports | Price corrections increasingly evident in most apartment and villa submarkets, with further moderation expected (9 August); prices largely steady (20 August); established end-user communities relatively resilient |
| Engel & Völkers: Natalie White | 9 September 2026 | Analysis using Cavendish Maxwell data | A selective correction rather than a market-wide crash; areas with significant upcoming supply may see softer pricing |
| Cavendish Maxwell: Ronan Arthur | H1 release; Q3 release | Registered sales and pipeline analysis | Clear signs of transitioning to a new cycle; demand fundamentals intact; near-term activity shaped by launches, regional uncertainty and normalising buyer activity |
| S&P Global Ratings | 7 October 2026 | Rating-agency view; base case assumes regional disruption continues into next year | Prices have fallen only moderately since the war began; 2027-2028 deliveries could accelerate the correction, especially in investor-driven apartments |
| Savills: Rachael Kennerley and Andrew Cummings | 12-13 October 2026 | Q3 2026 report; headline and like-for-like measures | A phase of rebalancing rather than a reversal; early signs of stabilisation in rents, uneven by location; prime segment resilient |
| ValuStrat (Haider Tuaima quoted in the Q2 release) | Q2 2026 review; 21 October 2026 | Valuation-based index, RICS Registered Valuers | Trajectory points toward a gradual plateau (Q2 release); Q3 prices broadly unchanged on the quarter |
Reading the table without ranking the outlooks, three points stand out. The only published figure that points to higher prices in 2026 is the Knight Frank forecast of 2 February, which was made before the conflict and was followed by Knight Frank’s 6 July statement that mainstream prices had ebbed by 5-20%. The only numerical range for a fall in the table is Fitch’s, a correction of up to 15%, which Fitch said in June may be larger. Most other entries are descriptions of direction without a number: modest cooling, selective correction, rebalancing, plateau. A comparison of forecasts therefore compares the vocabulary as much as the figures, which is addressed in the section on reading a forecast below. For a reader asking will Dubai property prices rise, the table shows the range of published answers and the dates on which they were given.
Savills’ Rachael Kennerley described the market as in a phase of rebalancing rather than a reversal. Moody’s said in February that large rated developers were well placed to absorb a moderate slowdown because of strong revenue backlogs and front-loaded payment structures, and S&P named Damac, Emaar, Omniyat and Sobha Realty as rated developers with large backlogs and limited payment delinquencies. Those are statements about the finances of developers, not about the price a buyer would pay for a particular home.
What the Authors Say Would Make Their Outlooks Wrong
Several authors state the conditions on which their view depends. The table collects those statements, so that a reader can see which developments each source itself treats as important. They are the authors’ own caveats and are not assessments made here.
| Source | Condition or risk the author names |
|---|---|
| Moody’s (10 February; 7 May note) | New supply being absorbed by population growth supports its view; a sharp slowdown or reversal in population inflows would worsen absorption risk as completed supply rises |
| Fitch (1 June 2026) | Weaker economic activity, reduced tourism and slower population growth would add pressure; corporate real estate loans likely the main source of new Stage 3 loans if the conflict is prolonged |
| Knight Frank (2 February) | Actual completions likely well below the pipeline given missed delivery dates; non-prime villa locations show price sensitivity |
| Knight Frank (6 July) | Further slowing of volumes over summer; the true impact of the regional conflict may not be clear until autumn if conditions stay stable |
| S&P Global Ratings (7 October) | Base case assumes regional disruption continues into next year; 2027-2028 deliveries in investor-driven apartments could accelerate the correction |
| IMF (17 July; 13 October) | Duration and intensity of the conflict uncertain; projections assume gradual normalisation and reopening of Hormuz from March 2027; downside risks include further escalation, upside a sustained easing of tensions |
| Cushman & Wakefield Core (August) | Contractor capacity, supply-chain pressures and geopolitical tension could delay handovers; early-stage projects most exposed |
| ValuStrat (15 August) | Pipeline figures to be treated cautiously; delays and rescheduling likely to lead to downward revisions |
| Cavendish Maxwell (Q3) | Number and frequency of launches, regional uncertainty and normalisation of buyer activity |
| Savills (12 October) | Population growth, household formation, affordability and financing conditions, and project-specific fundamentals as deliveries arrive |
| Engel & Völkers (9 September) | Supply by location: established villa communities with limited supply performed strongly; areas with significant upcoming supply may see softer pricing |
The conditions that decide will Dubai property prices rise, in the authors’ own framing, fall into four groups. Some concern supply (completions against schedule, the frequency of launches). Some concern demand (population inflows, tourism, buyer caution). Some concern money (rates, financing, bank asset quality). Some concern the regional situation (shipping, duration of the conflict). The sources name them but do not attach probabilities, and this article does not either. Where an author says the effect will be clearer later, as Knight Frank and Cavendish Maxwell do, the reading is that the data available at the time of writing did not yet settle the question.
Price and Rent Change by Area From Named Sources
Area-level data are scarcer than citywide data, and each table below comes from one source, one period and one method, because mixing sources by area mixes methods. The first two tables are from the Cushman & Wakefield Core Q2 2026 report as reported by Khaleej Times on 9 August 2026 (quarter-on-quarter changes in average sale prices and rents). The third is from the Savills Q3 2026 report as reported by Khaleej Times on 13 October 2026 (year-on-year changes in apartment rents for July-September).
Cushman & Wakefield Core: sale prices, Q2 2026, quarter on quarter
| Area | Segment | Change in sale prices |
|---|---|---|
| Palm Jumeirah | Apartments | -9% |
| Downtown Dubai | Apartments | -7% |
| Business Bay | Apartments | -7% |
| Dubai Hills Estate | Apartments | -4% |
| Jumeirah Village Circle | Apartments | -3% |
| The Springs and The Meadows | Villas | -9% |
| Dubai Hills Estate | Villas | -5% |
| Palm Jumeirah and Jumeirah Village Circle | Villas | Modest gains |
Cushman & Wakefield Core: rents, Q2 2026, quarter on quarter
| Area | Segment | Change in rents |
|---|---|---|
| Downtown Dubai | Apartments | -14% |
| Dubai Hills Estate | Apartments | -10% |
| Dubai Marina | Apartments | -10% |
| Palm Jumeirah | Apartments | -9% |
| Dubai Hills Estate | Villas | -12% |
Citywide, the same report had sale prices down 4% and average rents down 6% on the quarter. The firm said price corrections were increasingly evident across most apartment and villa submarkets and that established end-user communities were expected to stay relatively resilient.
Savills: apartment and villa rents, Q3 2026, year on year
| Area | Segment | Change in rents, year on year |
|---|---|---|
| Dubai Marina | Apartments | -12.8% |
| Business Bay | Apartments | -12.2% |
| Jumeirah Village Circle | Apartments | -10.4% |
| Al Furjan | Apartments | -7.5% |
| DIFC | Apartments | -7.3% |
| Majan | Apartments | -5.1% |
| Discovery Gardens | Apartments | -4.3% |
| International City Phases 2 and 3 | Apartments | -0.4% |
| Arabian Ranches 3 | Villas and townhouses | -15% |
| Damac Lagoons | Villas and townhouses | -13.4% |
Savills said the relatively modest quarterly movements suggest early signs of stabilisation, with the trend uneven across locations. The year-on-year rent changes in this table and the quarter-on-quarter changes in the Cushman & Wakefield Core table are not interchangeable: a 10% fall over one quarter would, if repeated, be larger than a 10% fall over a year. ValuStrat’s Q2 review gives a third area view from valuations rather than rents: annual villa capital-value gains of 17.9% in Jumeirah Islands, 10.7% in Emirates Hills and 10.0% in The Meadows, and quarterly apartment gains of 2.4% in International City, 1.4% in Dubai Sports City and 1.1% in Al Quoz Fourth. The Cushman & Wakefield Core table shows The Meadows with villa sale prices down 9% on the quarter alongside The Springs, which is a reminder that quarterly and annual changes, and sales and valuations, answer different questions.
How to Read a Forecast Before Asking Will Dubai Property Prices Rise
Forecasts in this market use ordinary words with specific meanings, and the same word can mean different sizes of move. The definitions below are those used in the sources in this article. The Engel & Völkers analysis, for example, separates moderation (slower growth), correction (selective price adjustments in particular segments) and market decline (sustained, widespread falls), and Fitch’s forecast uses correction for a fall of up to 15%.
| Term | Meaning as used by the sources | What to check |
|---|---|---|
| Forecast | A stated expectation of a future value, usually with a date or horizon | Who made it, when, and with what assumptions |
| Base case | The scenario the author treats as central, such as S&P’s assumption that disruption continues into next year | What happens to the number if the base case does not hold |
| Projection | A calculation conditional on stated assumptions, such as the IMF’s Hormuz timetable | Whether the assumptions are listed and still current |
| Correction | A fall that is smaller or more limited than a crash; Fitch used up to 15% | The starting point, the end date and the segment |
| Moderation or cooling | Slower growth, which can include flat or slightly lower prices | Whether the source gives a number |
| Plateau, stabilisation | Flat prices; Savills uses it for rents and ValuStrat for the residential trajectory | Whether the measure is a quarter, a month or a year |
| Nominal and real | Nominal prices are in current dirhams; real prices adjust for inflation | Which one the figure is |
| Year on year and quarter on quarter | Comparison with the same period a year before, or with the previous quarter | Quarterly figures cannot be read as annual rates |
| Average, median, like-for-like | Three ways of summarising a mixed set of sales | Whether mix may explain the movement |
A checklist for any forecast
- Identify the author and the date. A forecast written before 28 February 2026 was written without the conflict as an input.
- Identify the measure: transaction average, median, valuation index, or asking price, and the segment: all residential, apartments, villas, prime, off-plan or ready.
- Identify the horizon and the starting point. Fitch’s 15% runs from July 2025 to the end of 2026, so part of it is already in the 2025 and 2026 data.
- Identify the stated assumptions. S&P and the IMF both state a regional assumption; Moody’s and Savills state population and supply assumptions.
- Identify whether the number is a point estimate or a range, and whether the author says what would change it.
- Compare with the reported outcome on the same measure. A forecast for prime prices cannot be tested against a citywide average.
The DLD itself gives the clearest disclaimer on the point: on the index page it states that it does not claim any forecast accuracy and that external macroeconomic factors are not captured by its model. The same limit applies to every outlook in this article. The question of whether Dubai property prices will rise is a question about the future, while the sources can only report what has been measured and what their authors expect.
Percentages also work asymmetrically, which affects how a forecast of a fall followed by a rise should be read. A fall of 15% leaves 85% of the starting price, and a rise of 17.6% (0.15 / 0.85) is needed to return to it. A fall of 9.7% needs 10.7%. A forecast of a 15% correction followed by a 15% rise therefore does not return to the starting price; it ends at 97.75% of it (0.85 x 1.15). In the same way, a quarterly decline of 4.8% repeated for four quarters would compound to a 17.9% annual fall (1 – 0.952 to the power of 4), which no source forecasts; the example only shows why a single quarter should not be annualised.
Related Reading on This Site
This article stays with prices, transactions, supply and outlooks. Related topics are covered separately: the crash history and indicator dashboard for 2008-2026, how buyer protection works in Dubai for escrow and registration, the off-plan buyer guide for payment plans and assignment rules, the mortgage guide for bank financing, the area-by-area price per square metre guide, the guide to timing a purchase and the Dubai real estate market guide. For area profiles see Jumeirah Village Circle apartments and Downtown compared with Marina, and for ownership terms freehold and leasehold in Dubai and property taxes and fees in Dubai.
Frequently Asked Questions
Will Dubai property prices rise in 2027?
No source cited here publishes a probability. Knight Frank’s February 2026 forecast covered 2026 and was made before the conflict. Moody’s expected modest cooling over 12-18 months from February 2026, S&P said 2027-2028 deliveries could accelerate a correction in investor-driven apartments, and the IMF projected a 7.7% UAE GDP rebound in 2027 conditional on shipping normalising. Whether Dubai property prices will rise in 2027 is a forecast, and this article reports the sources without making one.
Are Dubai property prices falling in 2026?
The series disagree. Cavendish Maxwell had an average of AED 1,636 ($445) per sq ft in August, down 1.7% year on year. ValuStrat had its index about 10% lower in June than in late February and broadly unchanged in Q3. REIDIN had apartments down 0.4% and villas down 1.1% in Q3. CBRE had sale prices up 1.9% year on year in Q2. Knight Frank said mainstream prices had ebbed by 5-20% by location in its 6 July statement. The answer to will Dubai property prices rise is therefore stated differently by each source.
Which index measures Dubai property prices most accurately?
None is described by its publisher as the definitive measure. The DLD index uses a hedonic method and states that it provides no accuracy metrics, ValuStrat uses valuations, and the consultancies use averages or medians of registered sales. Each answers a different question, as the method table shows, and a comparison of two periods should use the same series when asking will Dubai property prices rise or fall.
How much new housing is due in Dubai?
Moody’s counted about 180,000 homes over 2026-2028, Cushman & Wakefield Core about 55,600 handovers in 2026 and more than 60,000 in 2027, Knight Frank more than 160,000 units in the registered 2026 pipeline, and Cavendish Maxwell 162,500 units scheduled for 2027. Cavendish Maxwell expects 14,000-23,500 of 47,000 units scheduled for H2 2026 to complete. Scheduled and delivered numbers differ, which is why the question of whether Dubai property prices will rise depends partly on how much of the schedule is completed.
What do the rating agencies say about the property market?
Moody’s expected modest cooling and modest apartment price declines over 12-18 months from February 2026. Fitch forecast a correction of up to 15% and in June 2026 said it may be larger. S&P said prices had fallen only moderately and that 2027-2028 deliveries could accelerate a correction in investor-driven apartments. The IMF described bank exposure to real estate as contained in July 2026.
What would change these outlooks, according to their authors?
The authors name supply delivered against schedule, population and tourism inflows, interest rates and financing, bank asset quality, and the duration of the regional conflict. The IMF’s projections assume Hormuz reopening gradually from March 2027. Cushman & Wakefield Core and ValuStrat say delays could reduce the delivered pipeline. The section on author-stated conditions lists each one with its date.
How many people live in Dubai and is the number growing?
The Dubai Data and Statistics Establishment counted 4,807,185 ordinarily resident people at midday on 28 September 2026, up 226,885 from 4,580,300 at the end of 2025. In 2025 the population grew by about 332,000. Moody’s and Fitch both name population inflows as a variable in their views of the market, and in the question of will Dubai property prices rise they are an input, not an outcome.
Where do rents stand in 2026?
The readings differ by source and measure: Cavendish Maxwell’s index was up 7.8% year on year in June, CBRE had average rents down 2.6% on the year in Q2, ValuStrat’s rental index was up 1.7% on the year, and Savills reported apartment rents down year on year in every listed area in Q3, from 0.4% in International City Phases 2 and 3 to 12.8% in Dubai Marina.
Does the UAE interest rate affect Dubai property prices?
The base rate rose to 3.9% on 17 September 2026 after the Fed raised its range to 3.75%-4%. Moody’s listed lower rates among the supports for affordability in February, and Savills lists financing conditions among the factors that matter as deliveries arrive. No cited source quantifies the effect of the 25-basis-point rise on prices.
Where can the primary data be found?
Transaction data are published by the Dubai Land Department, population and output by the Dubai Data and Statistics Establishment, tourism by the Department of Economy and Tourism, rates by the Central Bank of the UAE, and macro projections by the IMF and the EIA. Price and supply series come from consultancies such as Savills, Cavendish Maxwell, Knight Frank, CBRE, Cushman & Wakefield Core, ValuStrat and REIDIN, each with its own method.
Last checked: 28 October 2026. Sources: DLD 2025 data via Gulf News, DLD Q1 2026 release, DLD H1 2026 data via Emirates 24|7, DLD residential sales price index page, IMF staff statement, 17 July 2026, IMF World Economic Outlook, October 2026, The National on the IMF outlook, 13 October 2026, The National on Moody’s, 10 February 2026, Khaleej Times on S&P Global Ratings, 7 October 2026, Fortune on Fitch and Moody’s, 1 June 2026, Gulf News on Fitch, 29 May 2025, Knight Frank Dubai Residential Market Review Q4 2025, Knight Frank US$10m sales analysis, 6 July 2026, Gulf News on CBRE Q2 2026, Savills Q3 2026 release via Zawya, Savills Dubai Residential Market Report Q3 2026, Khaleej Times on Savills rents, 13 October 2026, Cavendish Maxwell H1 2026 release via Zawya, Cavendish Maxwell Q3 2026 release via Zawya, Cavendish Maxwell August 2026 prices via Zawya, ValuStrat Dubai Real Estate Review Q2 2026 via Zawya, Dubai Chronicle on DDSE and ValuStrat data, 21 October 2026, Khaleej Times on Cushman & Wakefield Core Q2 2026, 9 August 2026, Khaleej Times on Cushman & Wakefield Core H1 2026, 20 August 2026, Khaleej Times on the pipeline to 2030, 15 August 2026, Engel & Völkers Dubai price analysis, 9 September 2026, Engel & Völkers Dubai H1 2026 report page, fäm Properties September 2026 report (DXBinteract, DLD records), REIDIN Dubai Real Estate Market Insights Q3 2026, 28 October 2026, Gulf News on DDSE population data, 29 September 2026, Emirates 24|7 on DDSE population data, 29 September 2026, Zawya on the CBUAE base rate, September 2026, EIA Short-Term Energy Outlook, 6 October 2026, Al Jazeera on Hormuz shipping, 12 October 2026, Gulf News on DET visitor data, 14 September 2026, Dubai Media Office on 2025 tourism, 9 February 2026.